Driving License Statistics
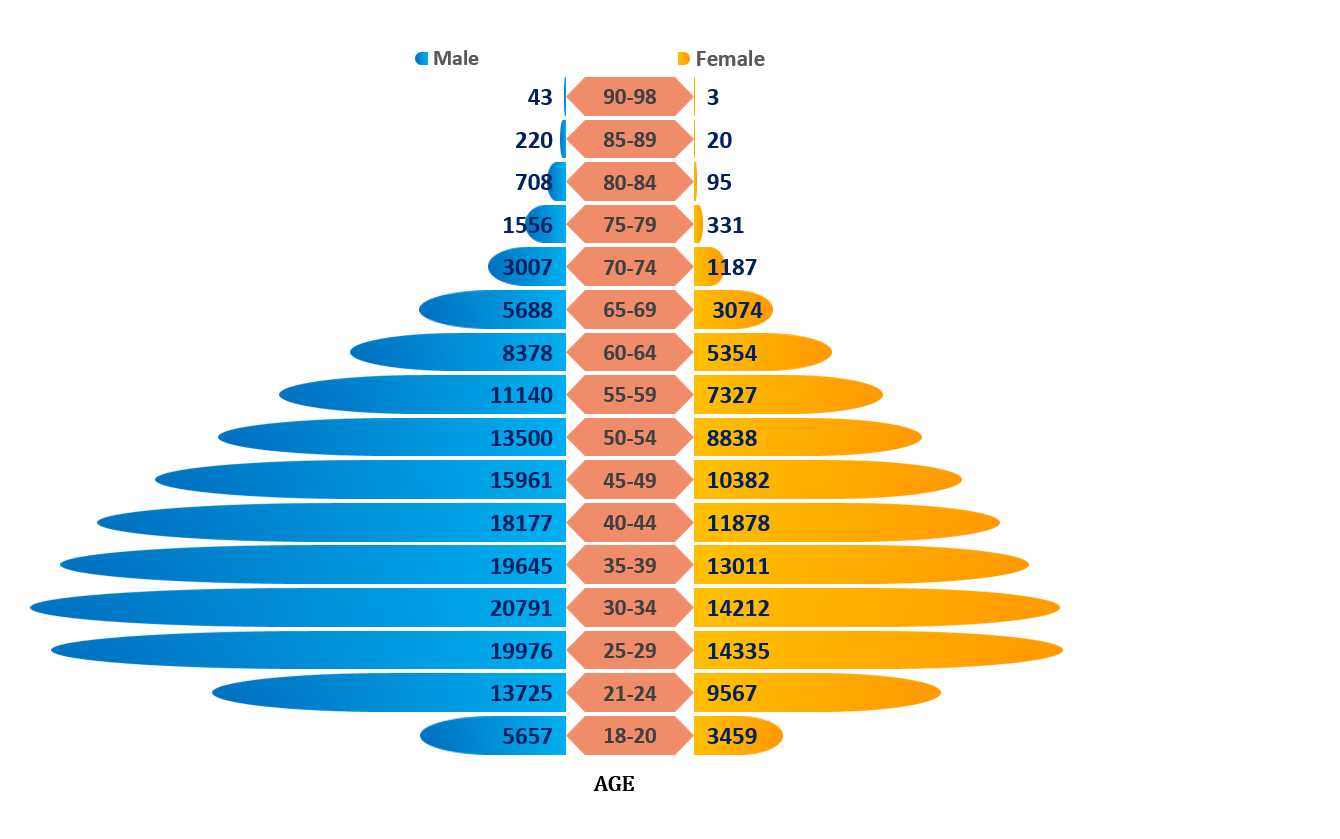
Diagram 1.0:
Statistic of Driving Licence by age and genders
_________________________________________________________________________________________
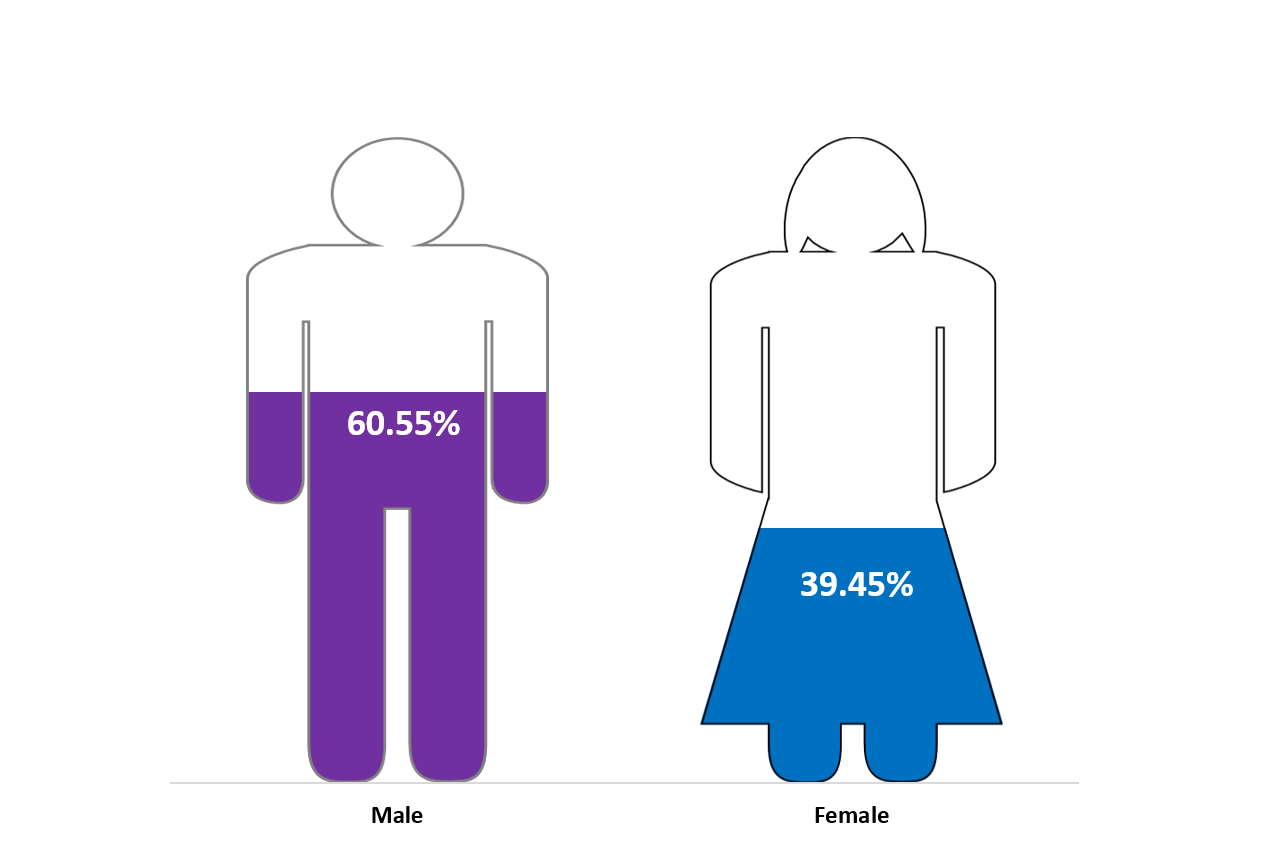
Diagram 2.0:
Statistic of Active Driving Licence Holder by gender
_________________________________________________________________________________________
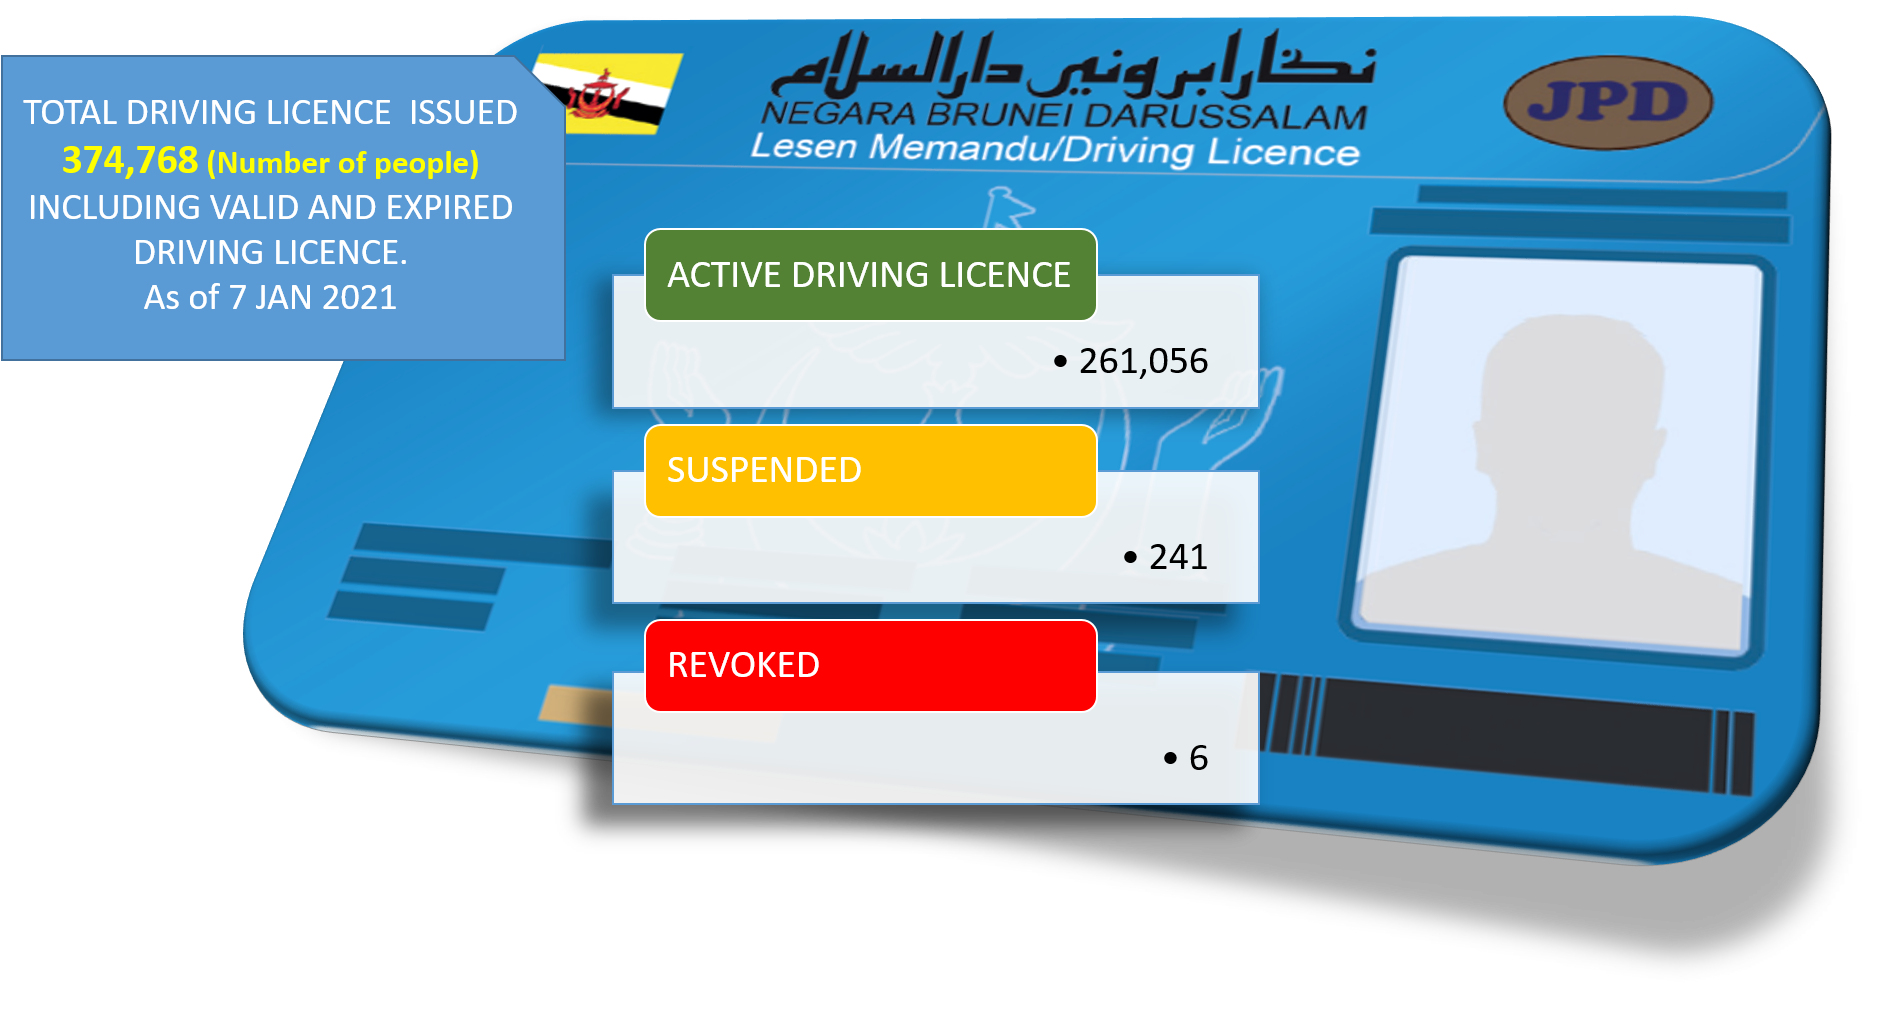
Diagram 3.0:
Statistic of Driving Licence by Active Driving Licence, Suspended and Revoked
_________________________________________________________________________________________
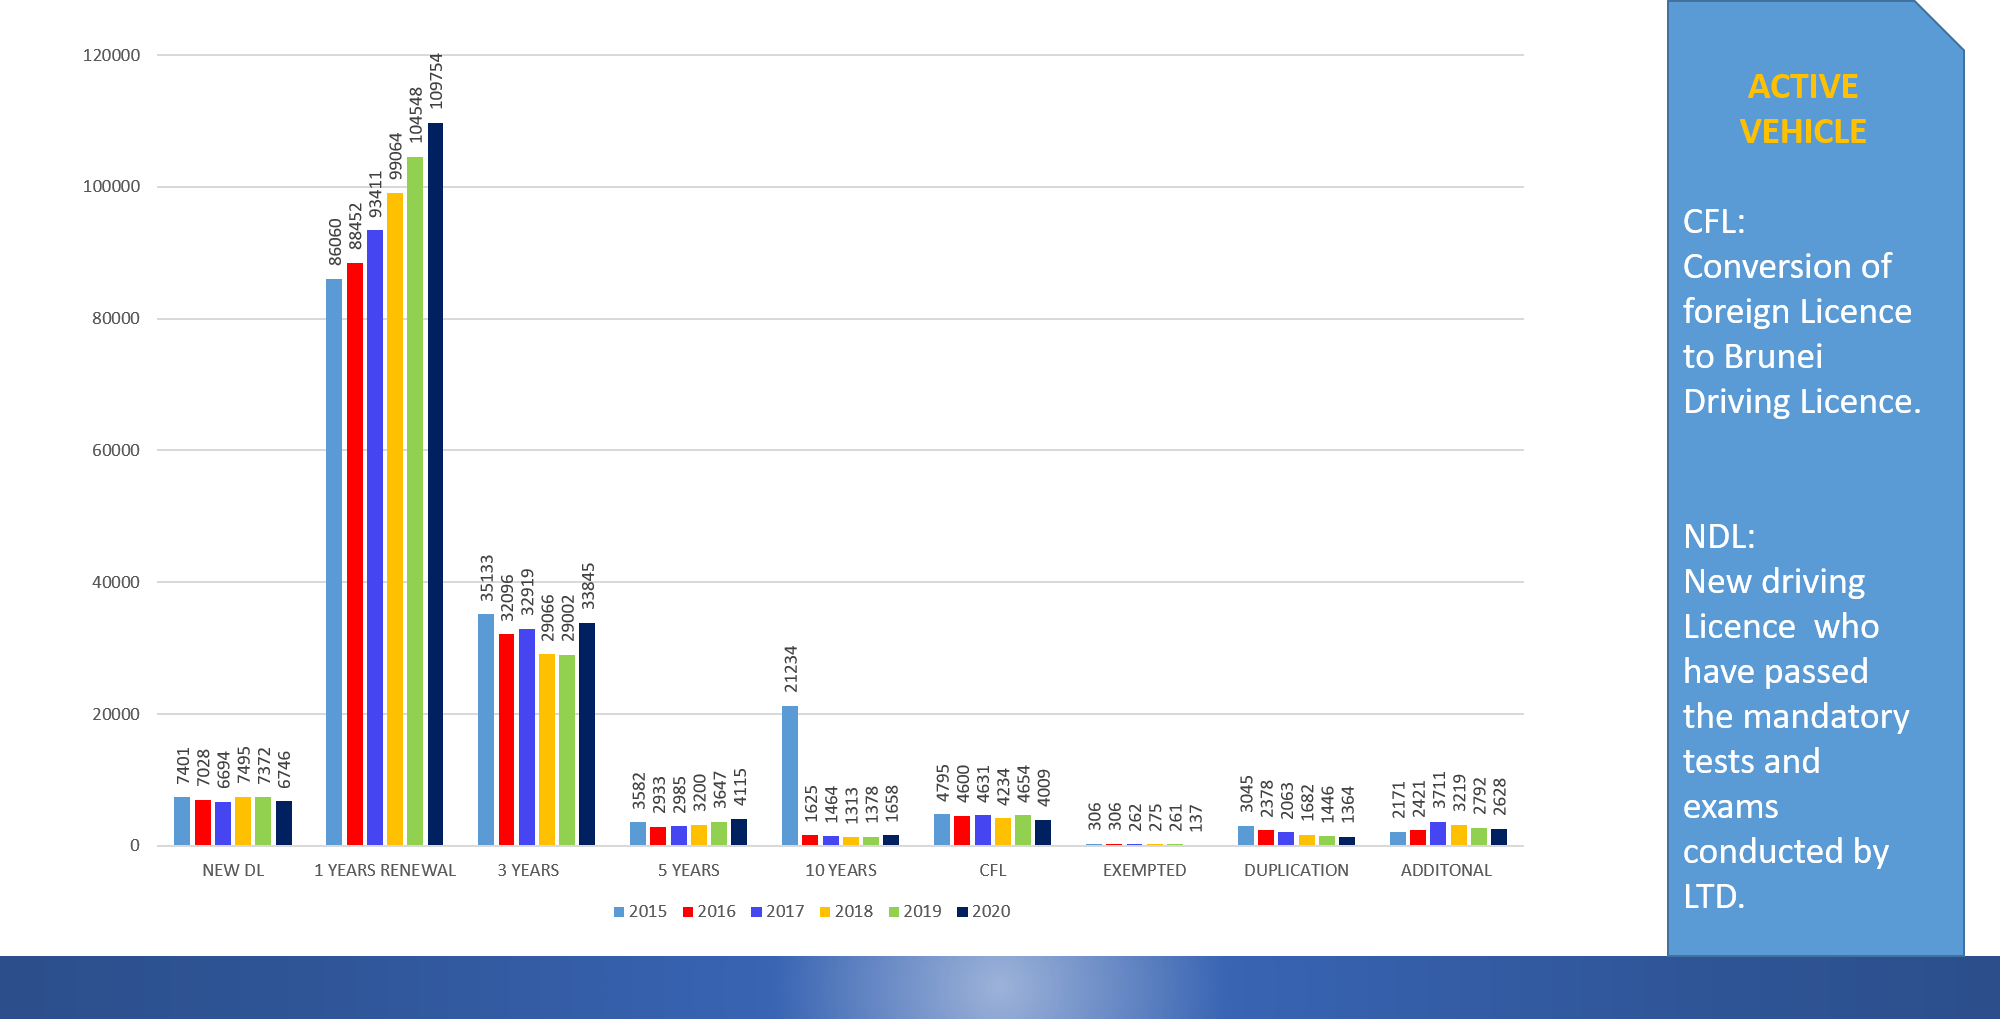
Diagram 4.0:
Statistic of Driving Licence issued from 2015-2020
_________________________________________________________________________________________
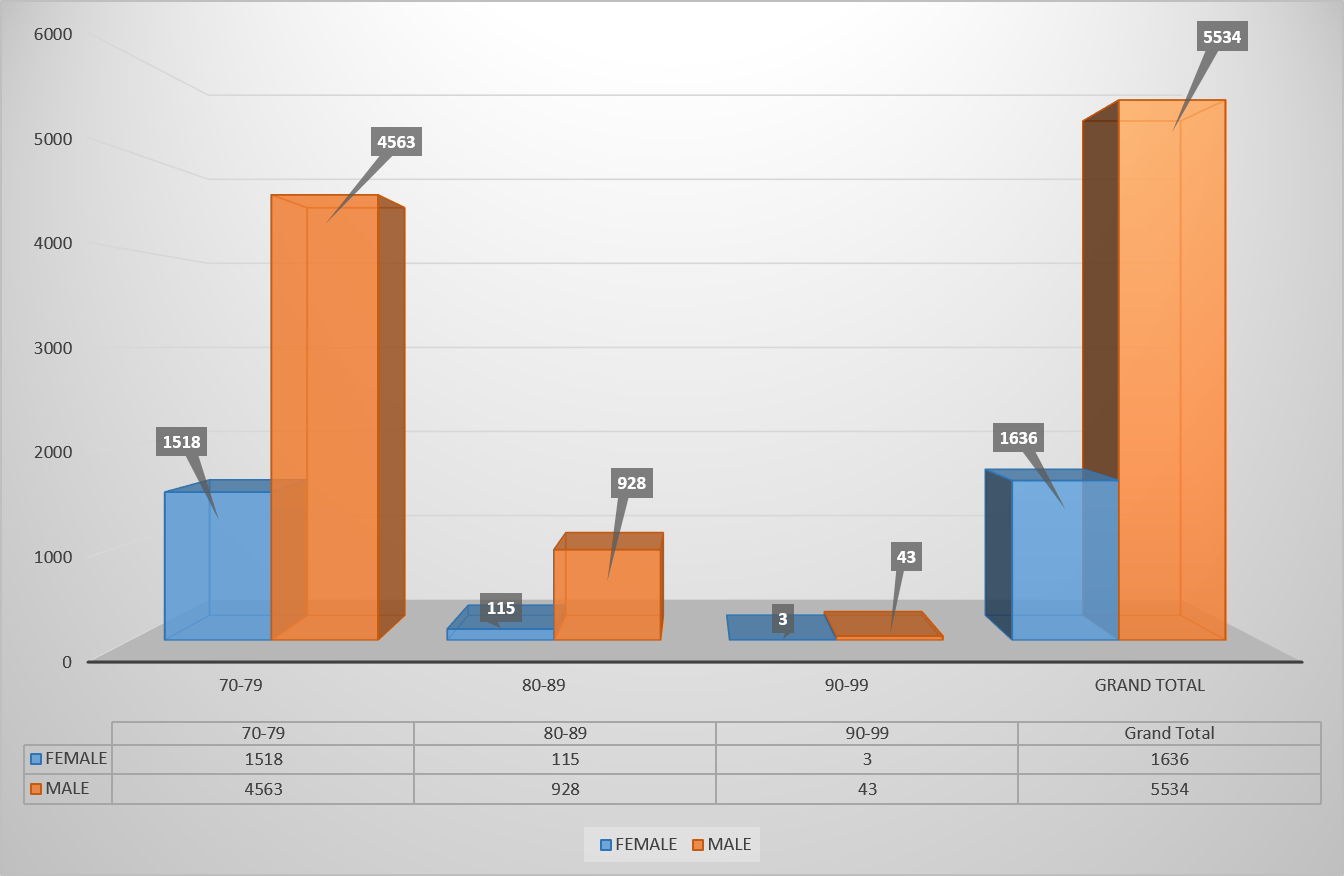
Diagram 5.0:
Statistic of Active Driving Licence Holder (70 years old above)
_________________________________________________________________________________________
updated as of 7th January 2021

